Over the past year, the largest mobile game advertisers have more than tripled the number of new ad creatives, while ad spending has grown at a significantly slower pace.
At the same time, the distribution of ads across channels and formats is shifting. Advertising strategies vary significantly depending on the game genre, brand recognition, and audience characteristics. Even a single game franchise may use completely different approaches for mobile and PC/console.
In its new “State of Game Advertising 2026” report, Sensor Tower examines game promotion across 41 markets. AdKeys team’ll take a closer look at the key trends emerging from the data and what they mean for marketers and mobile game developers.
The Number of Creatives Has Tripled, While Advertising Spending is Growing More Slowly
One of Sensor Tower’s most telling findings is the sharp increase in the number of ad creatives among the largest mobile game advertisers.
Sensor Tower analyzed a sample of 49 mobile games with the highest ad spend in Tier-1 markets. The median number of new ad creatives recorded in the U.S. increased from 135 per month in the first quarter of 2025 to 465 in the first quarter of 2026—a rise of approximately 3.4 times.
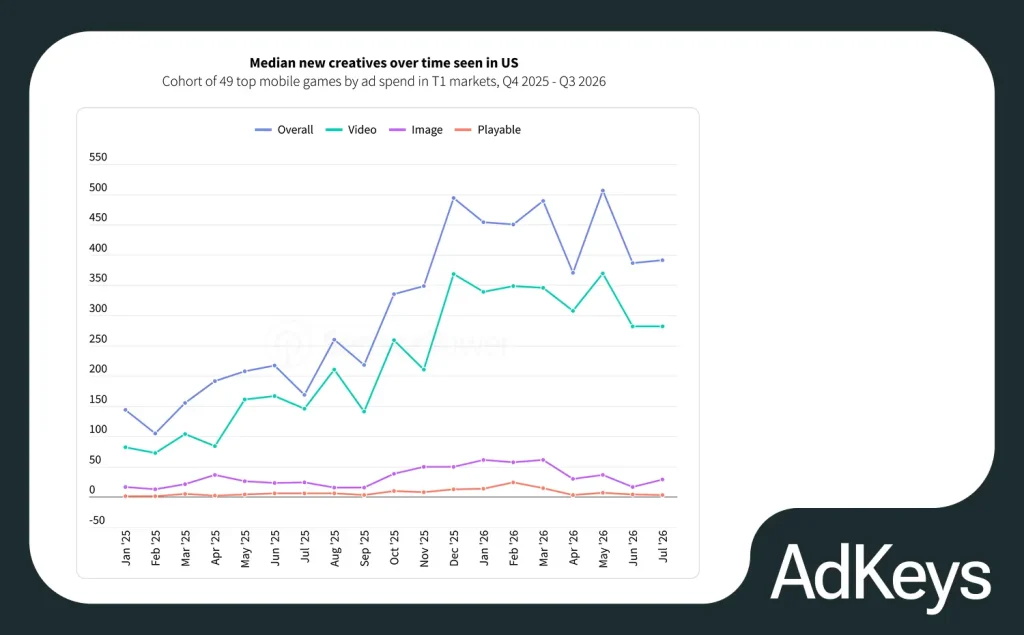
That said, the main surge occurred in 2025. In 2026, creative output remained high, although monthly figures fluctuated. Thus, this is not a case of continuous growth, but rather a consolidation of a significantly larger volume of advertising materials.
Ad spending by the same group over the comparable period increased by approximately 1.7 times—a notably slower rate than the growth in the number of new creatives. This does not mean that acquiring players has become cheaper or that advertisers have cut their budgets. However, it does show that the growth in advertising activity can no longer be explained solely by increased spending.
AppsFlyer had previously noted a similar trend. According to its “State of Gaming for Marketers 2026” study, the largest gaming advertisers released approximately 2,400-2,600 creative variations per quarter—25-30% more than a year earlier. We’ve already discussed these changes in our article on mobile game marketing in 2026.
Sensor Tower’s study confirms the overall trend, although it is not possible to directly compare the absolute figures from the two reports due to differences in sample sizes and methodology.
However, the new data allows us to look at the situation from a different angle: not only how much advertising content gaming companies are creating, but also how spending is distributed among them.
Mass Testing: Only a Few Creative Teams Get Large Budgets
One particularly interesting finding from Sensor Tower relates to the distribution of ad creatives by ad spend.
Additional Sensor Tower analysis revealed that, in the first quarter of 2026, the number of ad creatives with lifetime spending below $100 was more than six times higher than in the first quarter of 2025. At the same time, the number of creatives with total spending of $10,000 or more grew by approximately 1.7 times.
In other words, the number of ad variations with minimal spending is increasing significantly faster than the number of ads receiving large budgets.
This trend aligns with the mass testing model: advertisers launch more variations, test different approaches, and increase spending only on a subset of them. However, this data does not allow us to conclude that every creative with spending under $100 was a test, or that every variation with a large budget proved effective.
AppsFlyer’s “State of Creative Optimization 2026” study provides additional context. In the first quarter of 2025, the top 2% of gaming video creatives with the highest spend accounted for 53.5% of the budget for this format. In the second quarter of 2026, their share reached 60.7%.
It turns out that, as the number of ad variations increases, video ad spending is becoming increasingly concentrated on a small subset of them. Although AppsFlyer and Sensor Tower use different samples, both studies highlight the difference between mass-launching creatives and allocating significant budgets to them.
For UA teams, this highlights the importance of selecting and analyzing advertising materials. During the testing phase, the team tests specific hypotheses: which game mechanics attract attention, how the beginning of a video affects engagement, and which messages generate the most interest among potential players. During the scaling phase, it’s important to consider not only the response to ads but also the quality of acquired users, retention, and ROI.
Therefore, the number of creatives released alone says little about the effectiveness of an advertising strategy. What matters more is how quickly the team obtains test results, identifies promising options, and makes informed decisions about budget allocation.
Video Accounts For the Bulk of New Creative Content
Video was the main driver behind the increase in the volume of advertising content. According to Sensor Tower, throughout the period under review, video ads accounted for 70–75% of new creatives in a sample of major mobile game advertisers. Static images also began to be released more frequently: their median number rose from approximately 17 to 60 per month. Meanwhile, the number of new playable ads remained below 15 per month, even at its peak.
However, these figures do not mean that interactive ads are losing their effectiveness. Sensor Tower compares the number of new creatives, not their conversion rates, cost per install, or return on investment. Videos are generally easier to adapt: a single gameplay clip can be used to create multiple versions with different openings, editing, text, or calls to action. Interactive ads require the development of mechanics for user interaction with the ad.
Automation and generative AI help speed up production. These tools make it possible to create new variations, modify individual elements of videos, and adapt content for different formats. Sensor Tower views their widespread adoption as one possible explanation for the increase in the number of creative assets, although the study does not directly measure AI’s contribution.
However, increasing the number of variations shouldn’t be reduced to the mechanical production of dozens of similar videos. A more useful approach is to test individual elements: the first few seconds of the video, gameplay demonstrations, characters, rewards, or the advertising message.
At the same time, different formats should be evaluated differently. Unity’s guide to testing creatives covers not only videos and playable ads but also hybrid ads, where a short video transitions into an interactive gameplay segment.
Each format can serve its own purpose. Videos allow you to quickly showcase gameplay or pique interest with a storyline, while playable ads give users the chance to experience the mechanics even before installation.
Thus, the rise in video production does not eliminate the need to test other formats. It’s important not just to increase the volume of content, but to understand which advertising ideas and presentation methods are best suited for a specific game.
How Do Game Genres and the Market Influence the Choice of Advertising Channels?
The increase in the number of creatives is occurring alongside a shift in the distribution of advertising budgets across platforms. However, Sensor Tower shows that there is no single model for promoting mobile games.
In Sensor Tower’s classification, the “Display & Video” category includes, among other things, in-app advertising, while YouTube is counted separately under “TV & Streaming.” Therefore, this breakdown should not be interpreted as a simple ratio of banner ads, video, and social media.
In the third quarter of 2026, the Display & Video category accounted for about 57% of tracked global mobile game ad spending. Social media’s share stood at 29%, up from 24% the previous quarter.
However, it is important to note Sensor Tower’s classification: Display & Video includes in-app advertising, while YouTube falls under the TV & Streaming category. Therefore, these figures should not be interpreted as a simple breakdown of banner ads, video ads, and social media.
Budget allocation varied significantly by country. For example, in the U.S. and the U.K., Display & Video formats continued to play a major role, while in Japan and South Korea, the share of social media was notably higher. In Mexico, the share of social platforms gradually increased, reaching 44%.
In a separate comparison of social media platforms and YouTube, Sensor Tower also noted Instagram’s growth: in the third quarter of 2026, it accounted for 33.8% of the spending under review, YouTube accounted for 31.4%, and the combined share of Facebook and Instagram reached 56.2%.
The differences are also evident at the level of individual game genres.
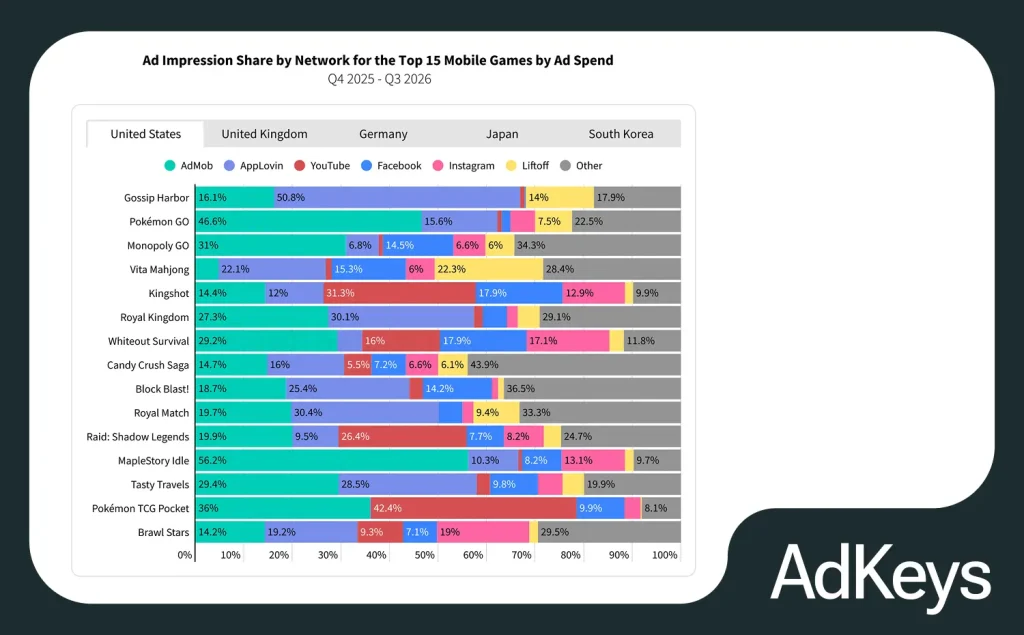
According to Sensor Tower, approximately 81% of Gossip Harbor’s ad impressions in the U.S. came from in-app networks: AdMob, AppLovin, and Liftoff.
For Kingshot, the picture was different: roughly 62% of impressions came from YouTube, Facebook, and Instagram. Whiteout Survival and Raid: Shadow Legends showed a similar focus on social platforms.
This is not an absolute division between casual and strategy games. For example, the RPG MapleStory Idle directed a significant share of its ad impressions to mobile ad networks. But the comparison shows just how much ad distribution can vary, even among major gaming titles.
The position of individual networks is also changing. Sensor Tower recorded an increase in AppLovin’s share of ad impressions for seven of the ten largest gaming advertisers in the sample under review. For Royal Kingdom, it rose from approximately 16% to 61%, and for Royal Match, from 20% to 54%.
For UA teams, these differences have practical implications. A user who sees a rewarded video or playable ad within another game is in a different context than someone watching videos on a social network.
Therefore, creative results from one platform cannot be automatically applied to another. Audience behavior, available formats, cost per acquisition, and user quality metrics may vary.
The media mix becomes part of the creative strategy: the choice of advertising channels influences what creative assets need to be produced and which hypotheses need to be tested.
Reels Is Gaining Share on Facebook, While In-Stream Ads Dominate on YouTube
Not only is the choice of advertising channels changing, but so is the way budgets are allocated across individual ad placements. Sensor Tower observed particularly noticeable changes on Facebook.
In the fourth quarter of 2025, Facebook’s main feed accounted for 52% of mobile game ad spending. By the first quarter of 2026, Reels had taken the lead, and by the third quarter, their share had reached 70%. Over the same period, the Feed’s share dropped to 22%.
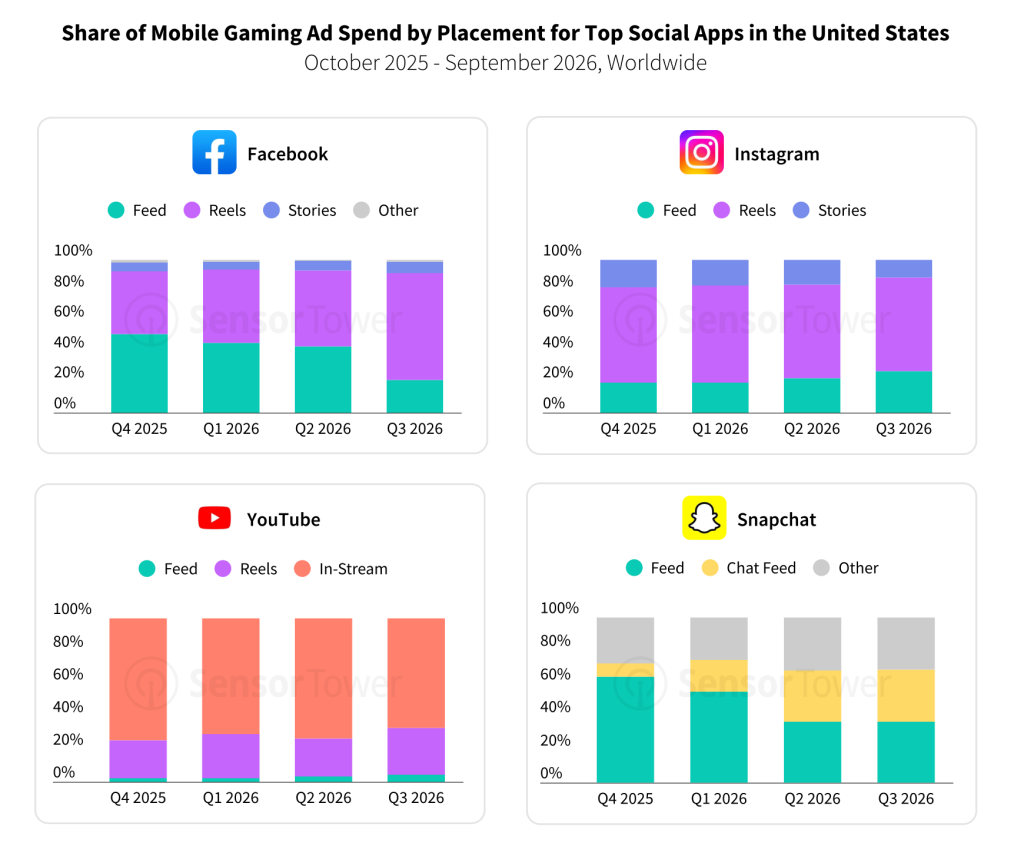
On Instagram, the situation is different. Reels already accounted for the bulk of ad spending—about 61-64% throughout the period under review. Meanwhile, the share of Stories declined from 18% to 12%, while the Feed’s share, conversely, rose from 20% to 27%.
On YouTube, in-stream ads remained the primary format, accounting for 67-75% of spending. On Snapchat, the role of the Chat Feed grew significantly: from 8% to 32%. The share of the regular feed during the same period declined from 64% to 37%.
Thus, it would be incorrect to speak of a uniform shift in gaming advertising from traditional feeds to short videos. Facebook is showing a pronounced shift toward Reels, Instagram already predominantly uses this format, and YouTube maintains a high share of in-stream ads.
It is also interesting to note that these changes depend on the type of games being promoted. For example, in advertising for PC/console projects, Facebook Feed still accounted for 86-88% of spending, while Reels accounted for only about 9-11%.
For marketers, this means that choosing a platform is only part of the challenge. It’s equally important to consider the specific placement, its format, and audience behavior.
It’s helpful to analyze creative performance not only by ad network but also by individual placements, if such granular data is available. This helps determine where ad content is truly suitable for scaling and where it needs to be adapted.
Well-Known Brands and Organic Installations: What Sensor Tower Shows
A game’s visibility is tied to where new users come from. According to Sensor Tower, games based on licensed intellectual property (IP) receive significantly more installs from organic search than games with original IP.
Between October 2025 and September 2026, organic search accounted for 37.9% of installations for licensed IP games, compared to 22.1% for original IP games. Meanwhile, the share of installations attributed to paid display advertising was 16.7% and 39.8%, respectively. The share of paid search promotion in both groups was roughly the same—about 5%.
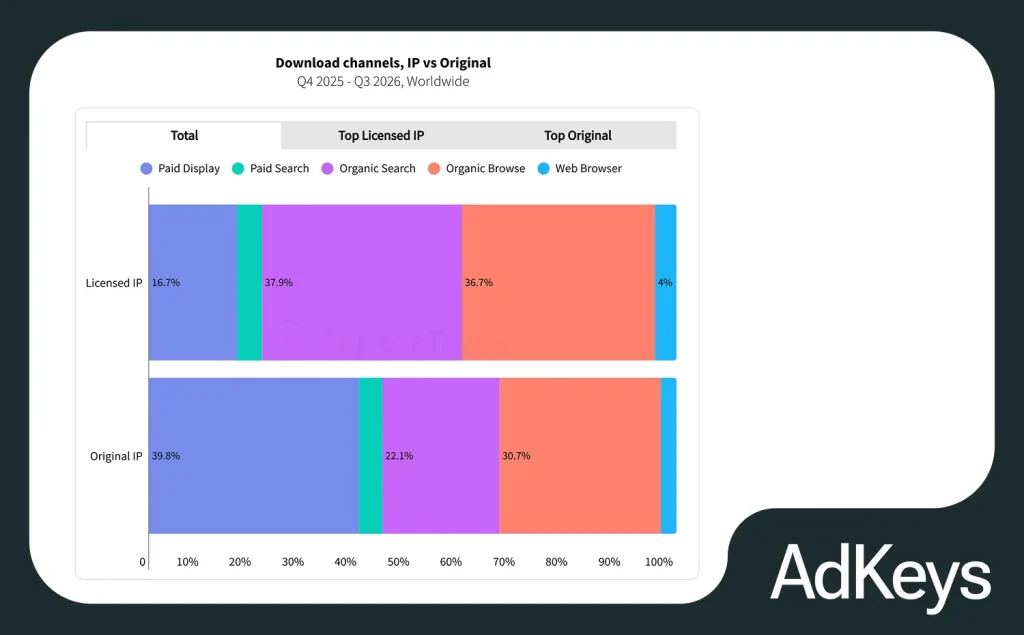
The difference is even more noticeable when looking at individual games. Call of Duty: Mobile received 54% of its installs from organic search and 9% from paid media advertising. For Gossip Harbor, the ratio is almost the opposite: 5% from organic search and 82% from paid display.
An important exception is Candy Crush Saga. Although the game is not based on a third-party licensed franchise, over the years it has established its own recognizable brand. As a result, 35% of its installs came from organic search and only 20% from paid display advertising. In terms of user acquisition, Candy Crush turned out to be closer to games with well-known IPs than to other original projects.
However, a high organic share does not mean that such games no longer need paid advertising. The percentages cited do not reflect the absolute cost of acquiring players. Furthermore, organic installs do not always occur independently of marketing: a user might see an ad, remember the game’s name, and later find it on their own in the app store.
For marketers, it’s important to take a broader view of UA effectiveness. In addition to direct installs from ad campaigns, it’s useful to track trends in organic search, branded queries, and the total number of installs. This helps assess changes in demand, although it doesn’t in itself prove what portion of organic growth is attributable to advertising.
Brand awareness can support organic acquisition, but it is no substitute for working with paid channels.
One Franchise—Different Strategies. And It's Not Just About the Channels
When a game or franchise is available on multiple platforms at once, it seems logical to use different advertising channels to attract mobile and PC/console audiences. Data from Sensor Tower confirms that major gaming companies do indeed often follow this approach. But there is an interesting exception: sometimes the advertising platform remains the same, while the ad content changes almost entirely.
Let’s start with budget allocation. In the U.S., mobile ad networks accounted for 55.4% of Fortnite’s spending, 54.7% of Call of Duty’s, 59.6% of EA Sports FC’s, and 48.9% of Delta Force’s on promoting their mobile versions. In the PC/console campaigns for these franchises, this channel was hardly used at all. YouTube and Instagram played the main roles there, and in some cases, OTT, television, and video ads on computers.
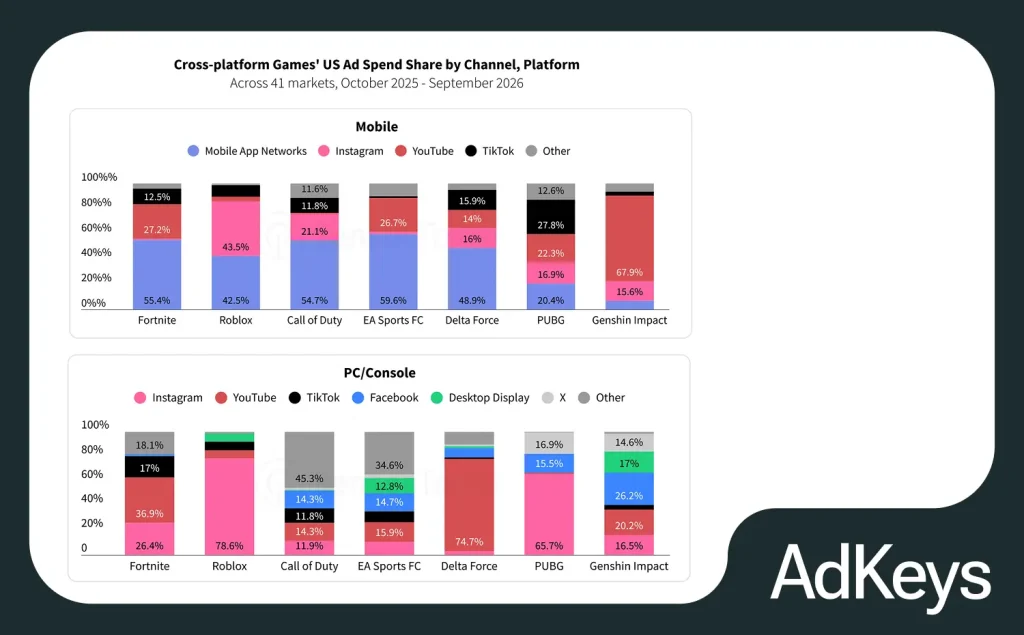
The difference is particularly noticeable with Delta Force. In mobile campaigns, spending was distributed among in-app ad networks, YouTube, Instagram, and TikTok. In contrast, when promoting the PC/console version, nearly 75% of the tracked budget went to YouTube.
Roblox shows that the differences between mobile and PC/console promotion extend beyond the choice of advertising channels. Instagram accounted for a significant share of the budget in both areas—about 44% and 79%, respectively. Among the highest-spending PC/console creatives on YouTube were the shooter Frontlines and the projects Fisch and Dragon Adventures, while Prism Runway, Detective Duck, and Super Golf! were promoted via Instagram mobile ads.
Different devices don’t necessarily mean different advertising channels. But even when the platforms overlap, that doesn’t mean a single creative strategy will suffice for both audiences.
That’s precisely why cross-platform promotion can’t be reduced to simply allocating a budget across devices or ad networks. It’s not just the channel through which a user sees the ad that matters, but also what they’re shown.
For marketers, this means that even a successful campaign shouldn’t always be automatically ported from one platform to another. Before adapting the creative, you need to understand which gameplay features appeal to a specific audience and which presentation method is best suited for the chosen channel.
Ongoing Advertising vs. Peak Campaigns: How Advertising Calendars Differ
The differences between mobile and PC/console advertising are also evident in how budgets are allocated over time.
According to Sensor Tower, mobile versions of major gaming franchises often maintain advertising activity throughout the year. Campaigns for PC/console titles—especially premium games with regular releases—are significantly more tied to the release of new installments.
For example, Call of Duty: Mobile was advertised in the U.S. every month from January 2025 through September 2026. Monthly spending ranged from $300,000 to $1.7 million, totaling $11.3 million over the 21-month period.
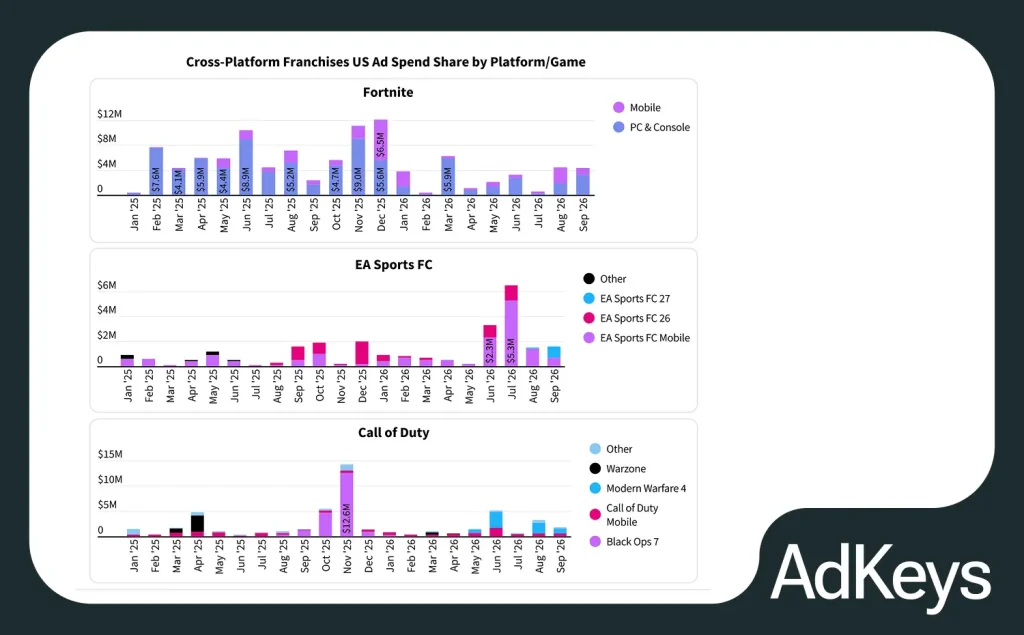
The budget allocation for *Call of Duty: Black Ops 7* was quite different. Approximately $20 million was spent on promoting the game over five months, with $12.6 million spent in November 2025. After the main launch period, advertising activity dropped sharply.
A similar situation was observed with EA Sports FC. The mobile version turned out to be the franchise’s largest advertiser in the U.S., with spending of $17.1 million. It also had distinct peaks—for example, $5.3 million in July 2026. The promotion of EA Sports FC 26, by contrast, was concentrated around the traditional fall release window: total spending amounted to approximately $7.1 million.
This pattern is also confirmed by a separate analysis of nine premium PC/console games. Seven of them supported their announcements with paid advertising as early as the week of the presentation, and eight spent more in the first two weeks after release than in the two weeks leading up to it.
However, this model is not typical for all PC/console projects. For example, Fortnite maintained significant advertising spending on these platforms throughout 2025, and after the mobile version returned to the U.S. App Store, it significantly increased its promotion there as well. In December 2025, mobile spending reached $6.5 million, temporarily exceeding spending on PC/console.
Thus, it’s not so much about the device itself as it is about the game’s development model. Products with constant updates and a long lifecycle may require regular audience engagement, whereas games with individual major releases tend to focus their advertising budgets around the launch.
For marketers, this means that the advertising calendar must take into account not only seasonality and traffic costs but also the product’s lifecycle. For continuously evolving games, regularly engaging and re-engaging the audience is crucial, while for release-based projects, the focus is on building demand prior to launch and scaling campaigns during the launch period.
Nintendo and PlayStation: Different Priorities in Console Advertising
Changes are also evident in the advertising strategies of the console platforms themselves.
According to Sensor Tower, Nintendo accounted for 55.4% of tracked advertising spending on console platforms in the U.S. during the first nine months of 2026. PlayStation and Xbox accounted for 31.9% and 12.7%, respectively.
At the same time, the companies are focusing on different areas. Nintendo accounted for about 74% of advertising spending in the console hardware segment, driven by the promotion of the Switch 2. PlayStation, on the other hand, took the lead in advertising for subscription services with a 61% share.
PlayStation’s overall share of advertising spending increased from 19.8% in 2025 to 31.9% for January–September 2026. Together, Nintendo and PlayStation accounted for about 87% of tracked advertising spending on console platforms in the U.S.
The distribution of budgets shows that even within the console segment, advertising priorities vary significantly. Some companies focus on promoting devices, while others more actively advertise services and subscriptions. However, the share of spending does not allow for direct conclusions about sales or the effectiveness of campaigns.
From the Quantity of Advertising to the Quality of Solutions
Data from Sensor Tower shows that in 2026, increased advertising activity isn’t simply a matter of larger budgets. Game promotion is becoming more intense and requires a more flexible approach to ad management. Major gaming advertisers are producing significantly more creative assets, but only a fraction of them generate substantial spending. At the same time, choosing the right channels, formats, and advertising strategies for different audiences is becoming more complex.
For mobile user acquisition (UA), this means that the speed of creative production is just one component of effective promotion. It’s equally important to understand which ideas truly attract high-quality users, which channels are worth scaling them in, and how results change as spending increases.
As advertising opportunities expand, the key to success shifts from the volume of testing to the quality of decisions made based on the results.